
Topolines: Topological Smoothing For Line Charts
|
Topolines: Topological Smoothing For Line Charts |
Abstract
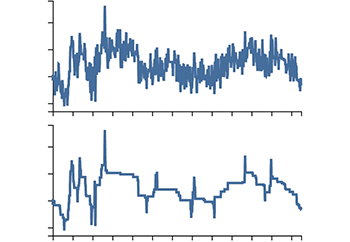
Line charts are commonly used to visualize a series of data values. When the data are noisy, smoothing is applied to make the signal more apparent. Conventional methods used to smooth line charts, e.g., using subsampling or filters, such as median, Gaussian, or low-pass, each optimize for different properties of the data. The properties generally do not include retaining peaks (i.e., local minima and maxima) in the data, which is an important feature for certain visual analytics tasks. We present TopoLines, a method for smoothing line charts using techniques from Topological Data Analysis. The design goal of TopoLines is to maintain prominent peaks in the data while minimizing any residual error. We evaluate TopoLines for 2 visual analytics tasks by comparing to 5 popular line smoothing methods with data from 4 application domains.
Video
Downloads
![]()
![]()
Citation
Paul Rosen, Ashley Suh, Christopher Salgado, and Mustafa Hajij. Topolines: Topological Smoothing For Line Charts. EuroVis ’20 Proceedings of the Eurographics / IEEE VGTC Conference on Visualization: Short Papers, 2020.
Bibtex
@article{rosen2020topolines,
  title = {TopoLines: Topological Smoothing for Line Charts},
  author = {Rosen, Paul and Suh, Ashley and Salgado, Christopher and Hajij, Mustafa},
  journal = {EuroVis '20 Proceedings of the Eurographics / IEEE VGTC Conference on
    Visualization: Short Papers},
  year = {2020},
  abstract = {Line charts are commonly used to visualize a series of data values. When
    the data are noisy, smoothing is applied to make the signal more apparent. Conventional
    methods used to smooth line charts, e.g., using subsampling or filters, such as median,
    Gaussian, or low-pass, each optimize for different properties of the data. The
    properties generally do not include retaining peaks (i.e., local minima and maxima) in
    the data, which is an important feature for certain visual analytics tasks. We present
    TopoLines, a method for smoothing line charts using techniques from Topological Data
    Analysis. The design goal of TopoLines is to maintain prominent peaks in the data while
    minimizing any residual error. We evaluate TopoLines for 2 visual analytics tasks by
    comparing to 5 popular line smoothing methods with data from 4 application domains.}
}