
Visual Inspection Of Dbs Efficacy
|
Visual Inspection Of Dbs Efficacy |
Abstract
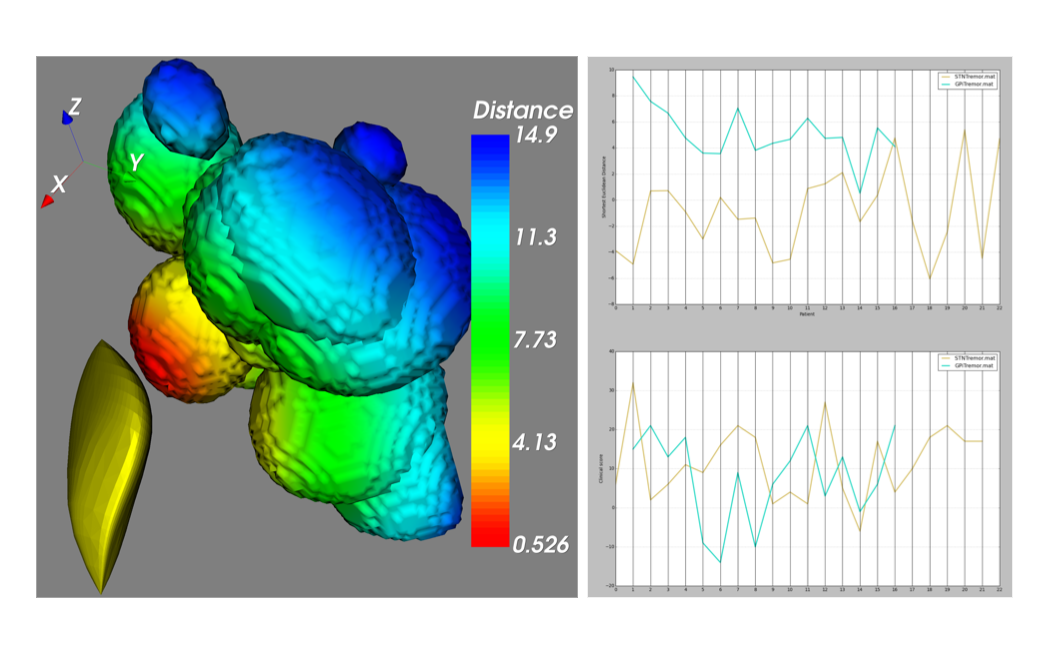
A key problem in Deep Brain Stimulation (DBS) is determining the optimal parameters for clinical outcome. Current knowledge does not provide a complete deterministic model of DBS neurophysiology. While multiple parameters may influence clinical outcomes in DBS, this paper explores spatial correlation of volume of tissue activated (VTA) to Unified Parkinson’s Disease Rating Scale (UPDRS) scores. Surface-to-surface Euclidean distance metrics between VTA and selected brain nuclei are used in a linked 3D and parallel coordinates view of patient outcome in UPDRS. We then present our approach based on semivariograms, which can be used interactively within nuView to show spatial correlation of patient outcomes with VTA. As a third component, nuView provides a unique visualization of an ensemble of electrode placements to reduce clutter and emphasize electrodes with spatially similar VTA.
Downloads
![]()
![]()
Citation
Brad E Hollister, Gordon Duffley, Chris Butson, Chris R. Johnson, and Paul Rosen. Visual Inspection Of Dbs Efficacy. IEEE SciVis Short Papers, 2019.
Bibtex
@inproceedings{hollister2019visual,
  title = {Visual Inspection of DBS Efficacy},
  author = {Hollister, Brad E and Duffley, Gordon and Butson, Chris and Johnson, Chris R.
    and Rosen, Paul},
  booktitle = {IEEE SciVis Short Papers},
  year = {2019},
  abstract = {A key problem in Deep Brain Stimulation (DBS) is determining the optimal
    parameters for clinical outcome. Current knowledge does not provide a complete
    deterministic model of DBS neurophysiology. While multiple parameters may influence
    clinical outcomes in DBS, this paper explores spatial correlation of volume of tissue
    activated (VTA) to Unified Parkinson's Disease Rating Scale (UPDRS) scores.
    Surface-to-surface Euclidean distance metrics between VTA and selected brain nuclei are
    used in a linked 3D and parallel coordinates view of patient outcome in UPDRS. We then
    present our approach based on semivariograms, which can be used interactively within
    nuView to show spatial correlation of patient outcomes with VTA. As a third component,
    nuView provides a unique visualization of an ensemble of electrode placements to reduce
    clutter and emphasize electrodes with spatially similar VTA.}
}