Evaluating Line Chart Strategies For Mitigating Density Of Temporal Data: The Impact On Trend, Trust, And Prediction
|
Evaluating Line Chart Strategies For Mitigating Density Of Temporal Data: The Impact On Trend, Trust, And Prediction |
Abstract
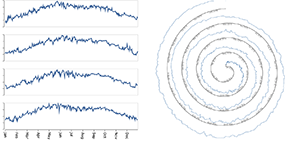
Overplotted line charts can obscure trends in temporal data and hinder prediction. We conduct a user study comparing three alternatives-aggregated, trellis, and spiral line charts against standard line charts on tasks involving trend identification, making predictions, and decision-making. We found aggregated charts performed similarly to standard charts and support more accurate trend recognition and prediction; trellis and spiral charts generally lag. We also examined the impact on decision-making via a trust game. The results showed similar trust in standard and aggregated charts, varied trust in spiral charts, and a lean toward distrust in trellis charts. These findings provide guidance for practitioners choosing visualization strategies for dense temporal data.
Downloads
![]()
![]()
Citation
Rifat Ara Proma, Ghulam Jilani Quadri, and Paul Rosen. Evaluating Line Chart Strategies For Mitigating Density Of Temporal Data: The Impact On Trend, Trust, And Prediction. Lecture Notes in Computer Science, 2026.
Bibtex
@article{proma2025linechart,
  title = {Evaluating Line Chart Strategies for Mitigating Density of Temporal Data: The
    Impact on Trend, Trust, and Prediction},
  author = {Proma, Rifat Ara and Quadri, Ghulam Jilani and Rosen, Paul},
  journal = {Lecture Notes in Computer Science},
  year = {2026},
  note = {textit{Presented at the International Symposium on Visual Computing 2025}},
  abstract = {Overplotted line charts can obscure trends in temporal data and hinder
    prediction. We conduct a user study comparing three alternatives-aggregated, trellis,
    and spiral line charts against standard line charts on tasks involving trend
    identification, making predictions, and decision-making. We found aggregated charts
    performed similarly to standard charts and support more accurate trend recognition and
    prediction; trellis and spiral charts generally lag. We also examined the impact on
    decision-making via a trust game. The results showed similar trust in standard and
    aggregated charts, varied trust in spiral charts, and a lean toward distrust in trellis
    charts. These findings provide guidance for practitioners choosing visualization
    strategies for dense temporal data.}
}