Visual Stenography: Feature Recreation And Preservation In Sketches Of Line Charts
|
Visual Stenography: Feature Recreation And Preservation In
Sketches Of Line Charts |
Abstract
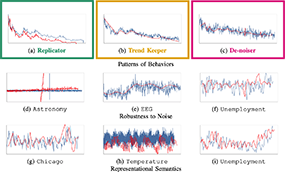
Line charts surface many features in time series data, from trends to periodicity to peaks and valleys. However, not every potentially important feature in the data may correspond to a visual feature which readers can detect or prioritize. In this study, we conducted a visual stenography task, where participants re-drew line charts to solicit information about the visual features they believed to be important. We systematically varied noise levels (SNR ~5-30 dB) across line charts to observe how visual clutter influences which features people prioritize in their sketches. We identified three key strategies that correlated with the noise present in the stimuli: the Replicator attempted to retain all major features of the line chart including noise; the Trend Keeper prioritized trends disregarding periodicity and peaks; and the De-noiser filtered out noise while preserving other features. Further, we found that participants tended to faithfully retain trends and peaks and valleys when these features were present, while periodicity and noise were represented in more qualitative or gestural ways: semantically rather than accurately. These results suggest a need to consider more flexible and human-centric ways of presenting, summarizing, pre-processing, or clustering time series data.
Downloads
![]()
![]()
Citation
Rifat Ara Proma, Michael Correll, Ghulam Jilani Quadri, and Paul Rosen. Visual Stenography: Feature Recreation And Preservation In Sketches Of Line Charts. IEEE Transactions on Visualization and Computer Graphics, 2026.
Bibtex
@article{proma2025stenography,
  title = {Visual Stenography: Feature Recreation and Preservation in
Sketches of Line Charts},
  author = {Proma, Rifat Ara and Correll, Michael and Quadri, Ghulam Jilani and Rosen,
    Paul},
  journal = {IEEE Transactions on Visualization and Computer Graphics},
  year = {2026},
  abstract = {Line charts surface many features in time series data, from trends to
    periodicity to peaks and valleys. However, not every potentially important feature in
    the data may correspond to a visual feature which readers can detect or prioritize. In
    this study, we conducted a visual stenography task, where participants re-drew line
    charts to solicit information about the visual features they believed to be important.
    We systematically varied noise levels (SNR ~5-30 dB) across line charts to observe how
    visual clutter influences which features people prioritize in their sketches. We
    identified three key strategies that correlated with the noise present in the stimuli:
    the Replicator attempted to retain all major features of the line chart including noise;
    the Trend Keeper prioritized trends disregarding periodicity and peaks; and the
    De-noiser filtered out noise while preserving other features. Further, we found that
    participants tended to faithfully retain trends and peaks and valleys when these
    features were present, while periodicity and noise were represented in more qualitative
    or gestural ways: semantically rather than accurately. These results suggest a need to
    consider more flexible and human-centric ways of presenting, summarizing,
    pre-processing, or clustering time series data.}
}